Texas Average Annual Sales Price for Single & Multi-Section Manufactured Homes
Rob Ripperda
The Census Bureau releases the previous year’s annual average price data for manufactured homes at the individual state level each summer.
For Texas, the average sales price for a new single-section manufactured home in 2025 was $87,300, up +0.7% nominally from the prior year but down -1.9% after adjusting for inflation*. The average multi-section price in the state was $151,500, up +3.1% nominally from 2024 and an inflation-adjusted +0.4%*.
After adjusting for inflation, the 2025 average single-section price in Texas was the lowest in four years, while the real multi-section price ticked up slightly from 2024 but remained below its 2021–2023 levels.
Manufactured Housing Survey’s Annual Average Selling Prices in Texas
Use the toggle to switch between current‑year (Nominal) and inflation‑adjusted (Real) prices.
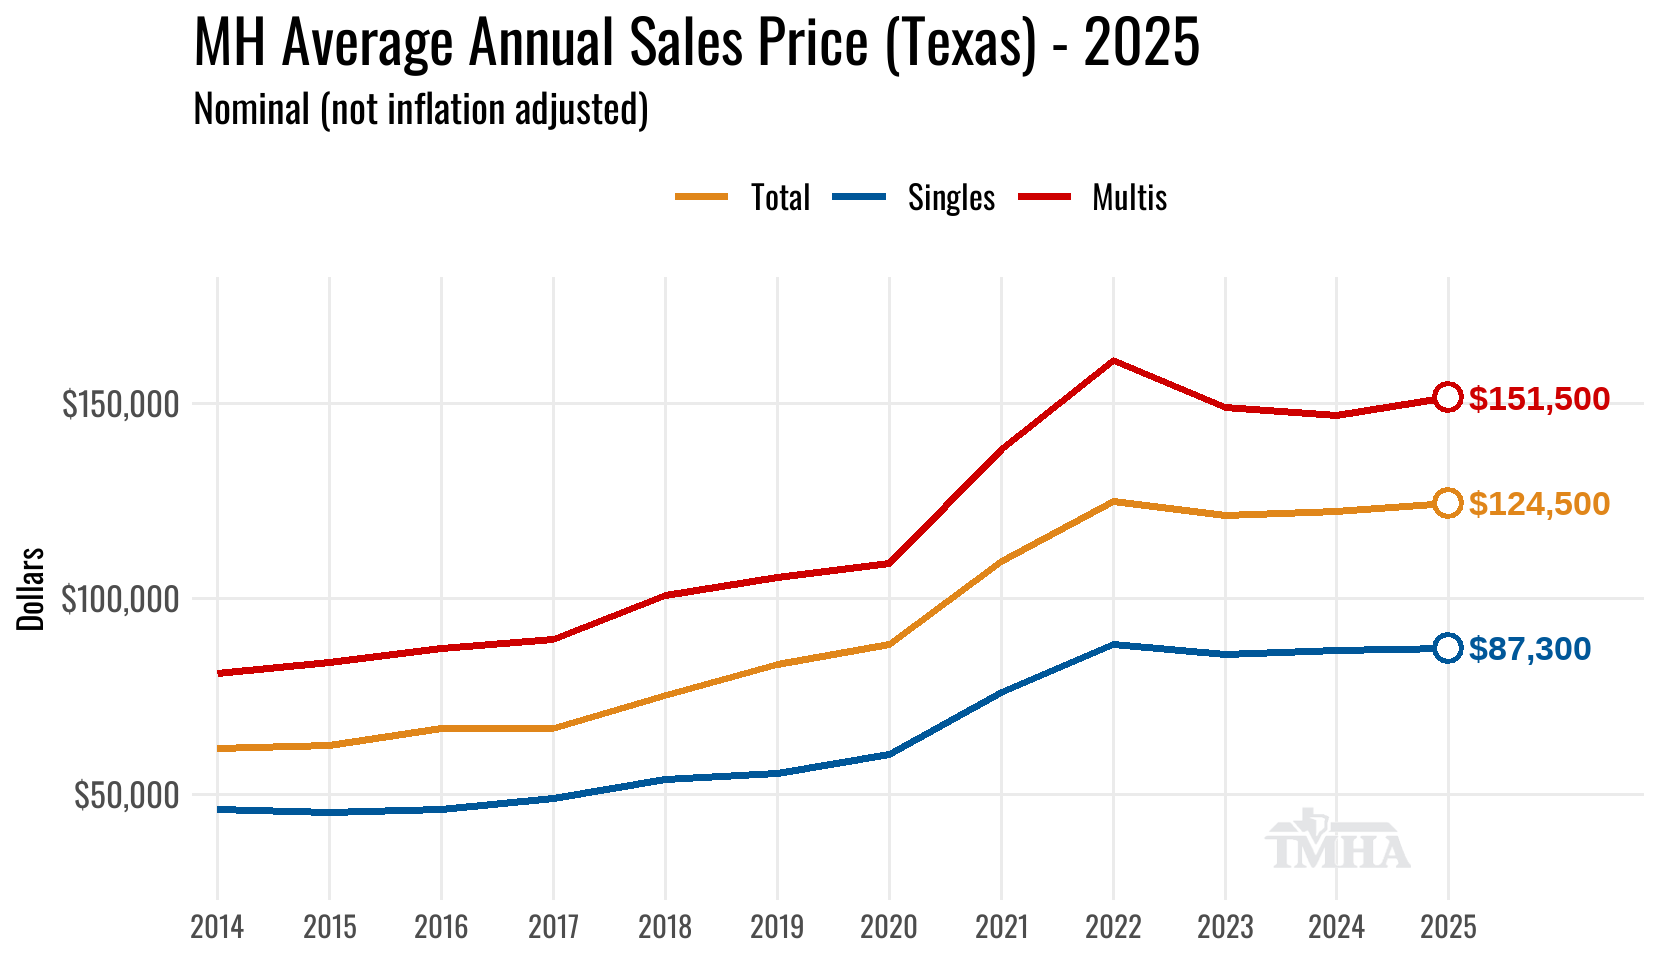
This chart is built off of the US Census Bureau’s Manufactured Housing Survey (MHS) Tables
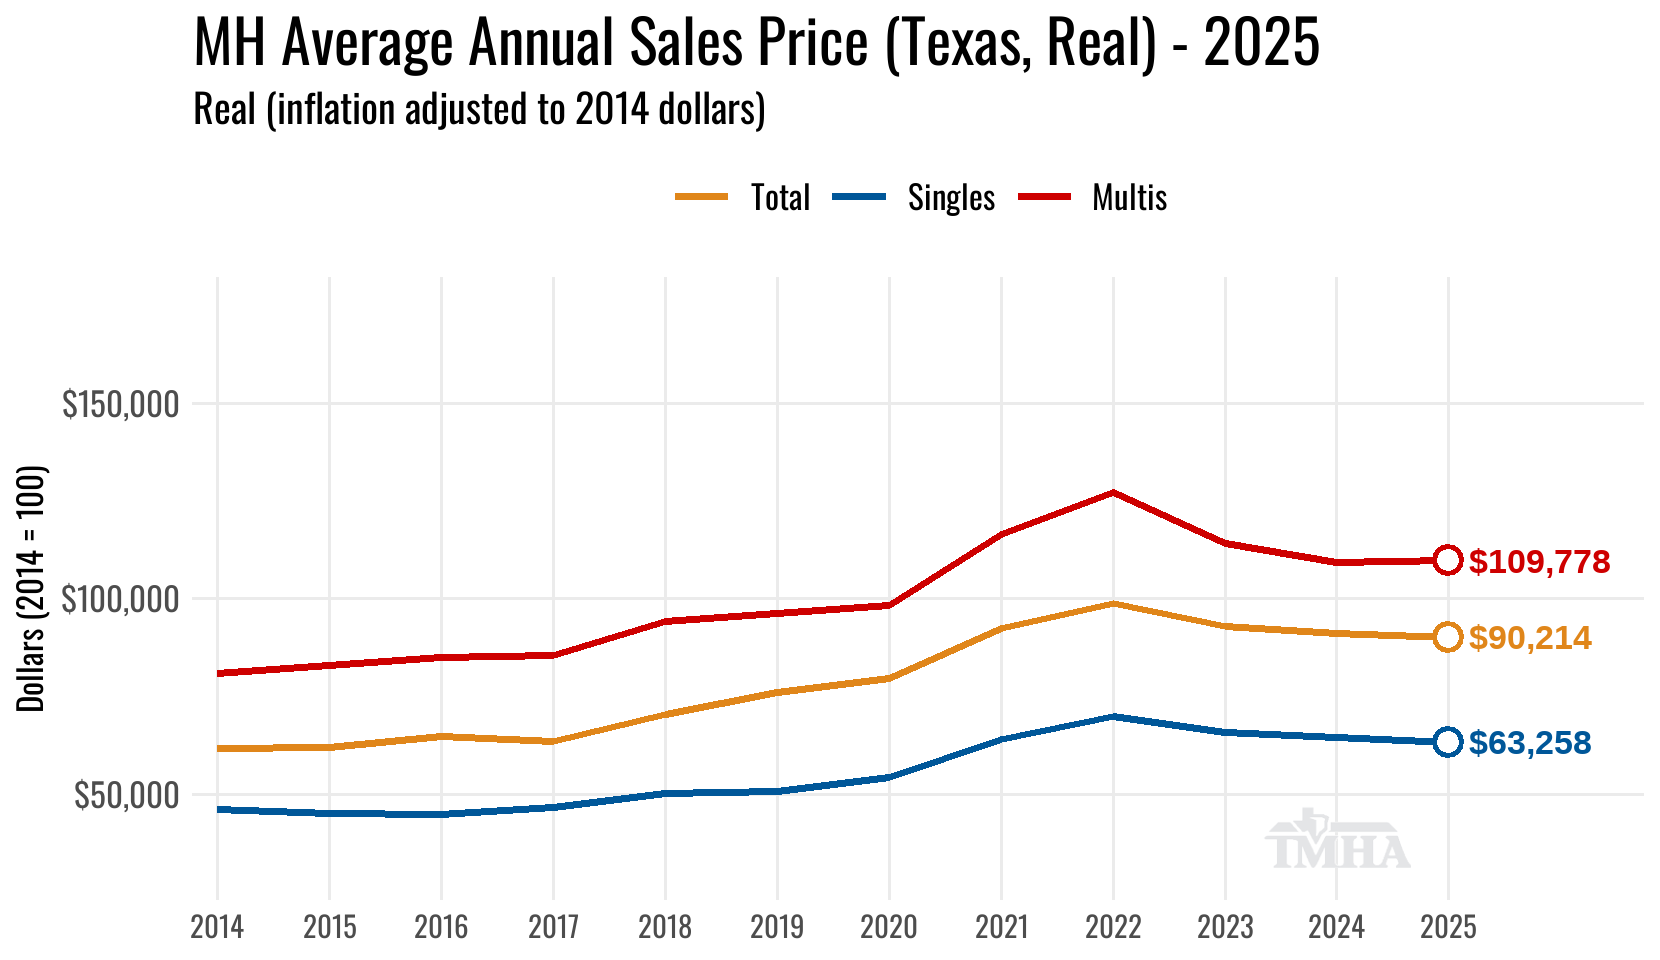
This chart is built off of the US Census Bureau’s Manufactured Housing Survey (MHS) Tables. Price values have been inflation adjusted to 2014 dollars.
* Inflation adjustments are made using the U.S. Bureau of Labor Statistics Consumer Price Index for All Urban Consumers.
How Texas Manufactured Home Prices Compare to Other States
Plotting every state on a single chart shows where Texas falls in the national picture. Each point is a state, positioned by its average single-section price (horizontal axis) and multi-section price (vertical axis). The dashed lines mark the national averages, so Texas’ average single-section price was slightly above the national average while the average multi-section price was below the national average selling price.
It is important to note that there are various models and price-points being sold in any given state market and a state’s particular distribution of model sales will influence where its average selling price lands, but Texas being the largest state market for manufactured housing sales is not surprisingly near the national average.
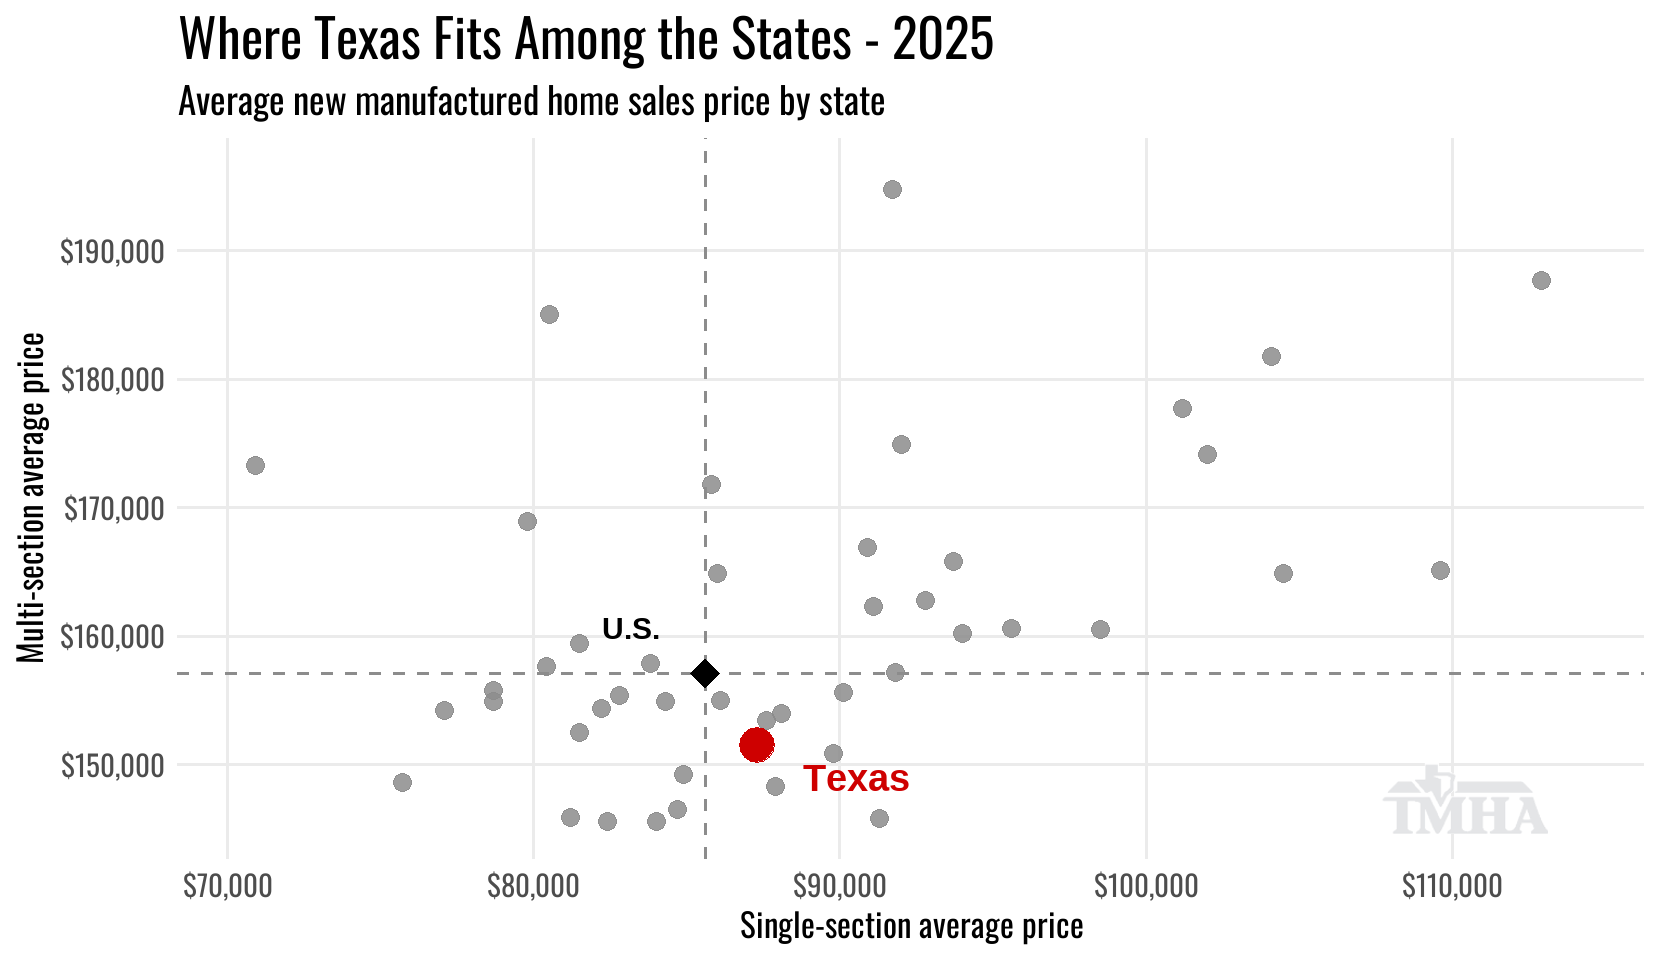
This chart is built off of the US Census Bureau’s Manufactured Housing Survey (MHS) Tables. States where the Census suppressed a single- or multi-section average to protect respondent confidentiality are omitted.